LLM Benchmarking Results
Detailed results from our knowledge graph analysis benchmark of various LLM models. These results are part of a research project on benchmarking LLM comprehension capabilities through graph connectedness analysis. View the knowledge graph visualizations or read the full blog post for complete methodology and analysis.
Final Model Rankings
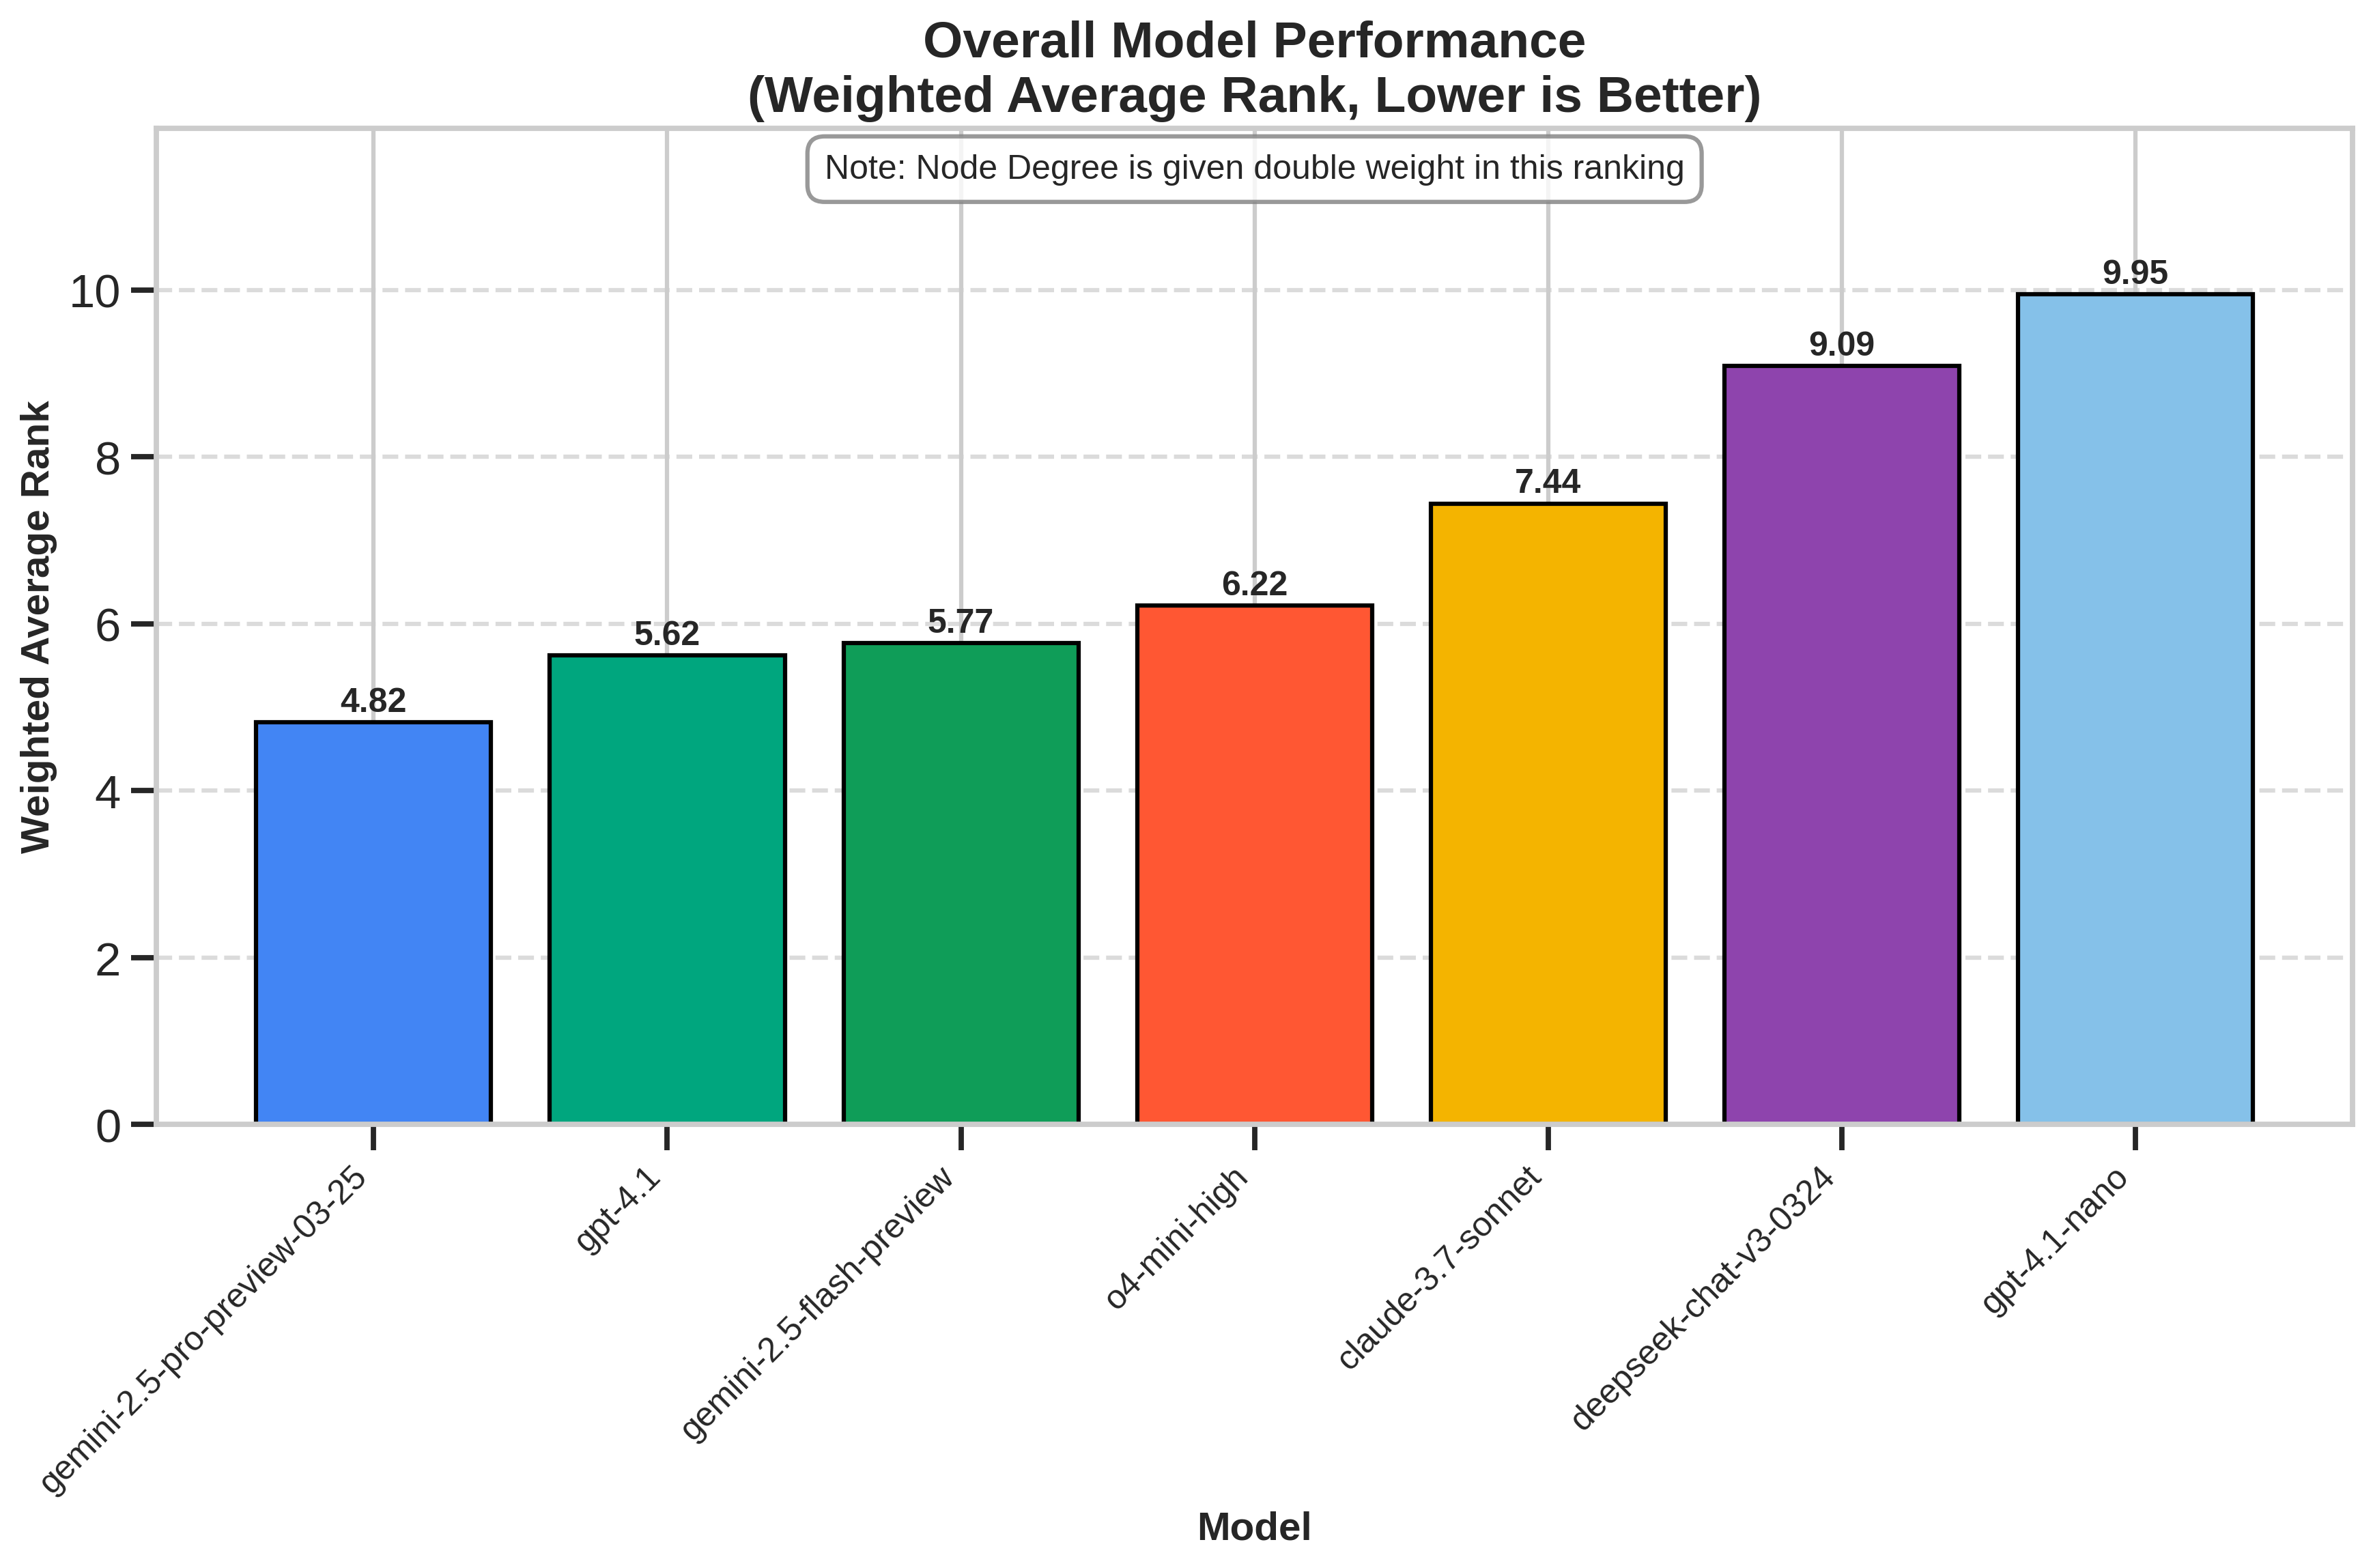
Comparative performance of various LLM models based on knowledge graph metrics. Click on any image to view it in full size.
Correlation with LMSys Arena
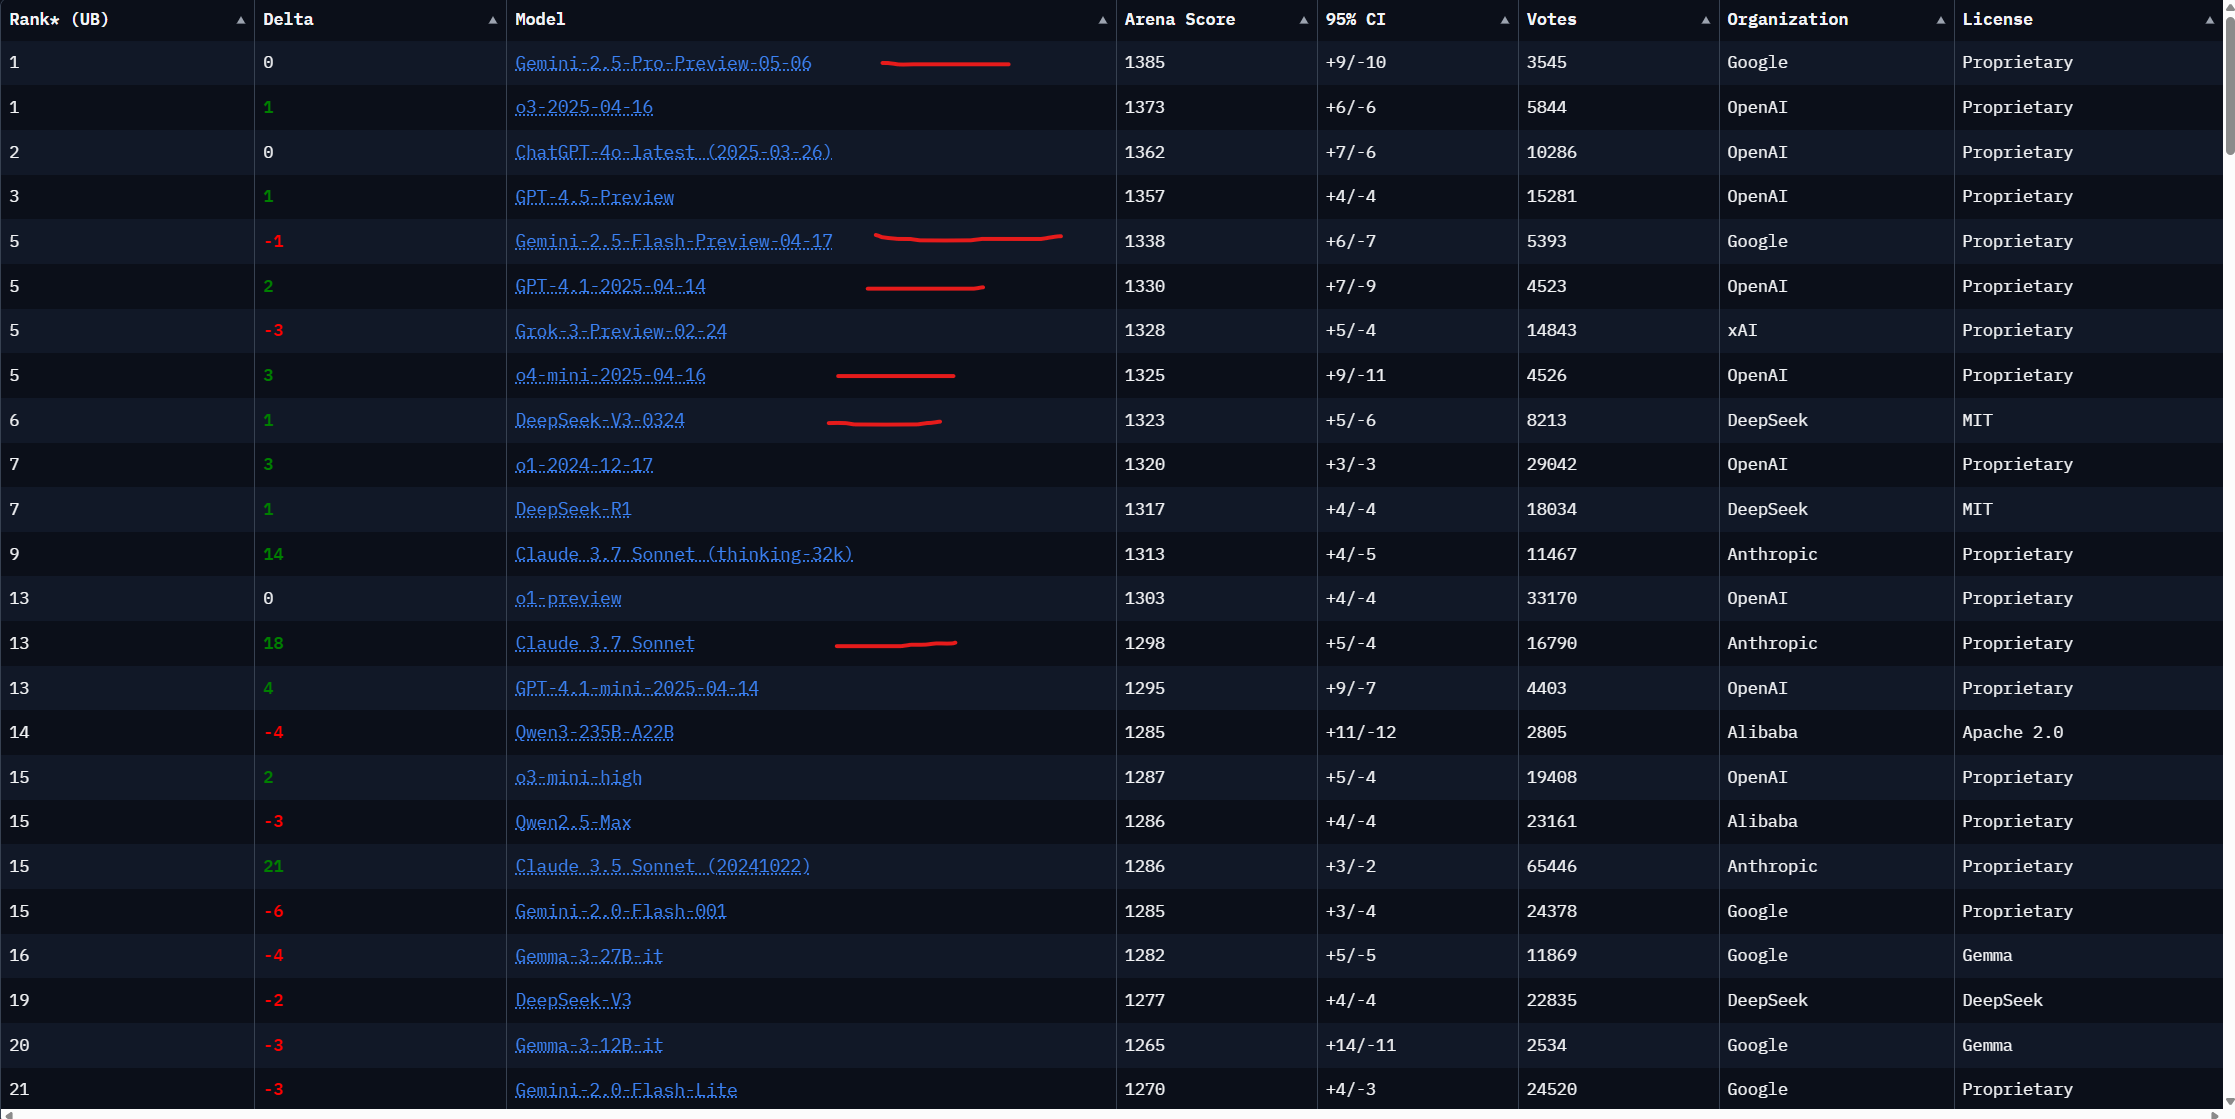
Comparing our knowledge graph analysis results with LMSys Arena rankings:
Ranking Methodology
The evaluation system ranks models based on several graph metrics:
| Metric | Description | Weight in Ranking |
|---|---|---|
| Average Node Degree | Average number of connections per node | 2.0 (Primary) |
| Node Count | Total number of concepts/entities | 1.0 |
| Edge Count | Total number of relationships | 1.0 |
| Graph Density | Ratio of actual connections to possible connections | 0.8 |
| Connected Components | Number of disconnected subgraphs (lower is better) | 1.0 |
| Largest Component Ratio | Size of largest component relative to total graph | 0.8 |
The overall ranking is calculated using a weighted average of normalized metrics. The evaluation gives double weight to average node degree, as this metric best captures the knowledge graph's interconnectedness and usefulness.
For each subject and model combination:
- Each metric is normalized to a [0,1] scale.
- Metrics are weighted according to importance.
- A composite score is calculated.
- Models are ranked by their average scores across all subjects.